# Setting up your own metrics on Lens
**URL:** https://forums.k8slens.dev/t/setting-up-your-own-metrics-on-lens/342
**Category:** FAQ
**Created:** [April 13, 2023, 4:35pm UTC](https://forums.k8slens.dev/t/setting-up-your-own-metrics-on-lens/342 "2023-04-13T16:35:06Z")
**Posts on this page:** 1
**Page:** 1
### Author:  [@jehrismann](https://forums.k8slens.dev/u/jehrismann)
#### Post date: [April 13, 2023, 4:35pm UTC](https://forums.k8slens.dev/t/setting-up-your-own-metrics-on-lens/342/1 "2023-04-13T16:35:06Z")
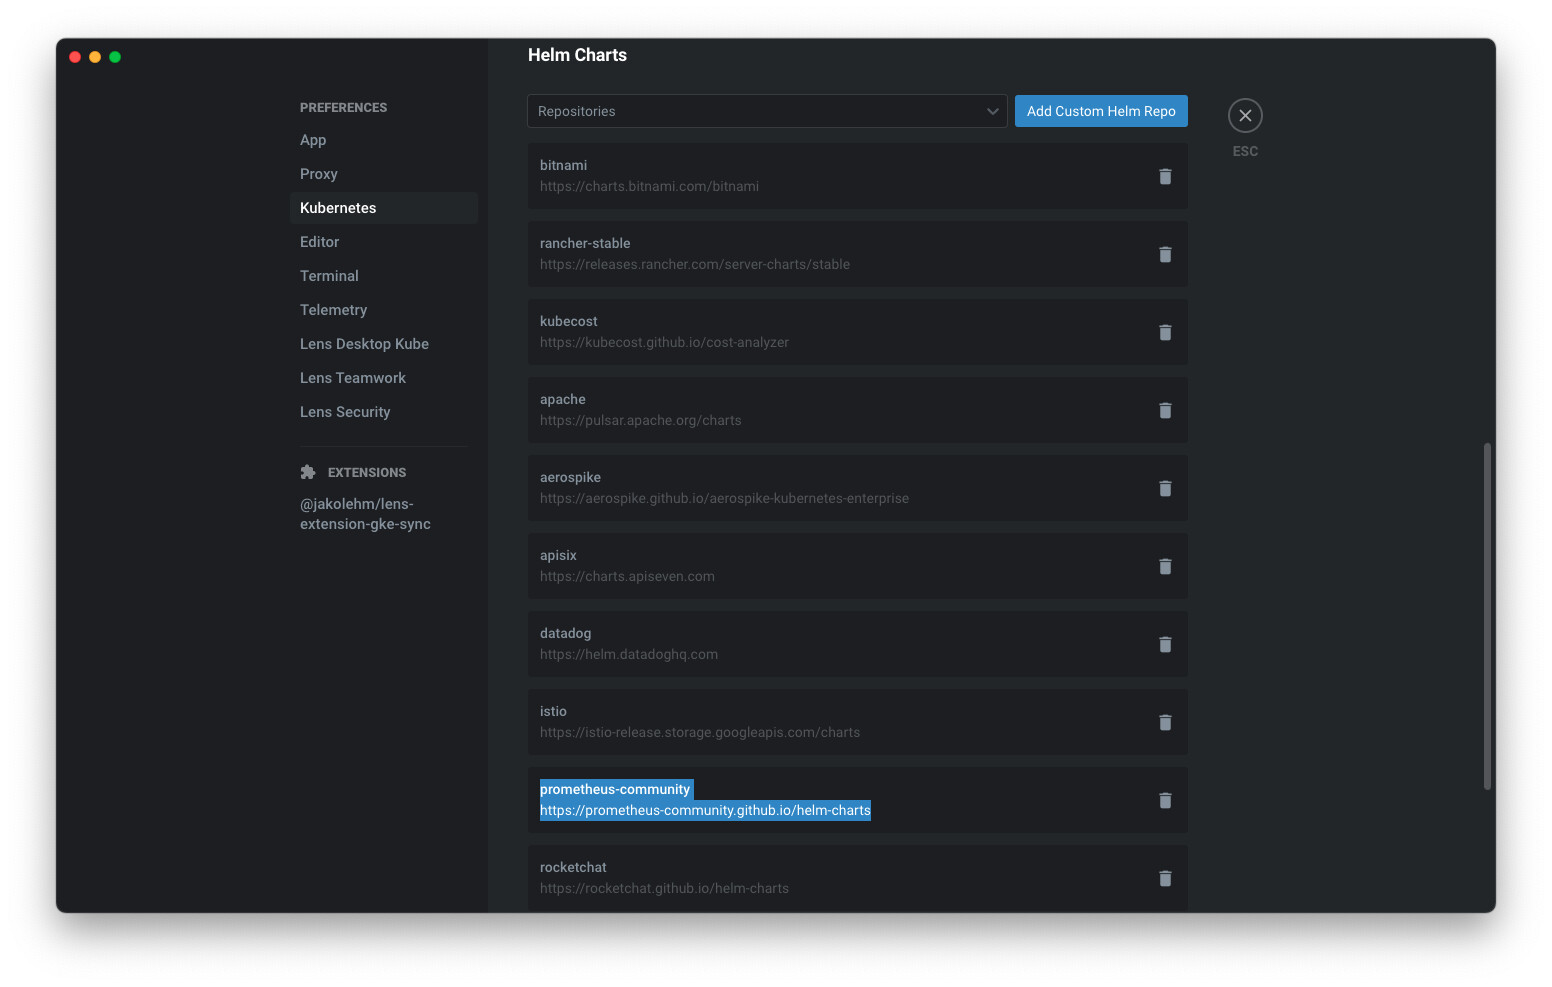
Install the prometheus chart from the prometheus-community repo ([Prometheus Community Kubernetes Helm Charts | helm-charts](https://prometheus-community.github.io/helm-charts)). You may need to add it as a custom repo to Lens (you can add custom helm repos by picking **Preferences** from the Lens menu, select the **Kubernetes** tab, find the **Helm Charts** section, click **Add Custom Helm Repo** ):
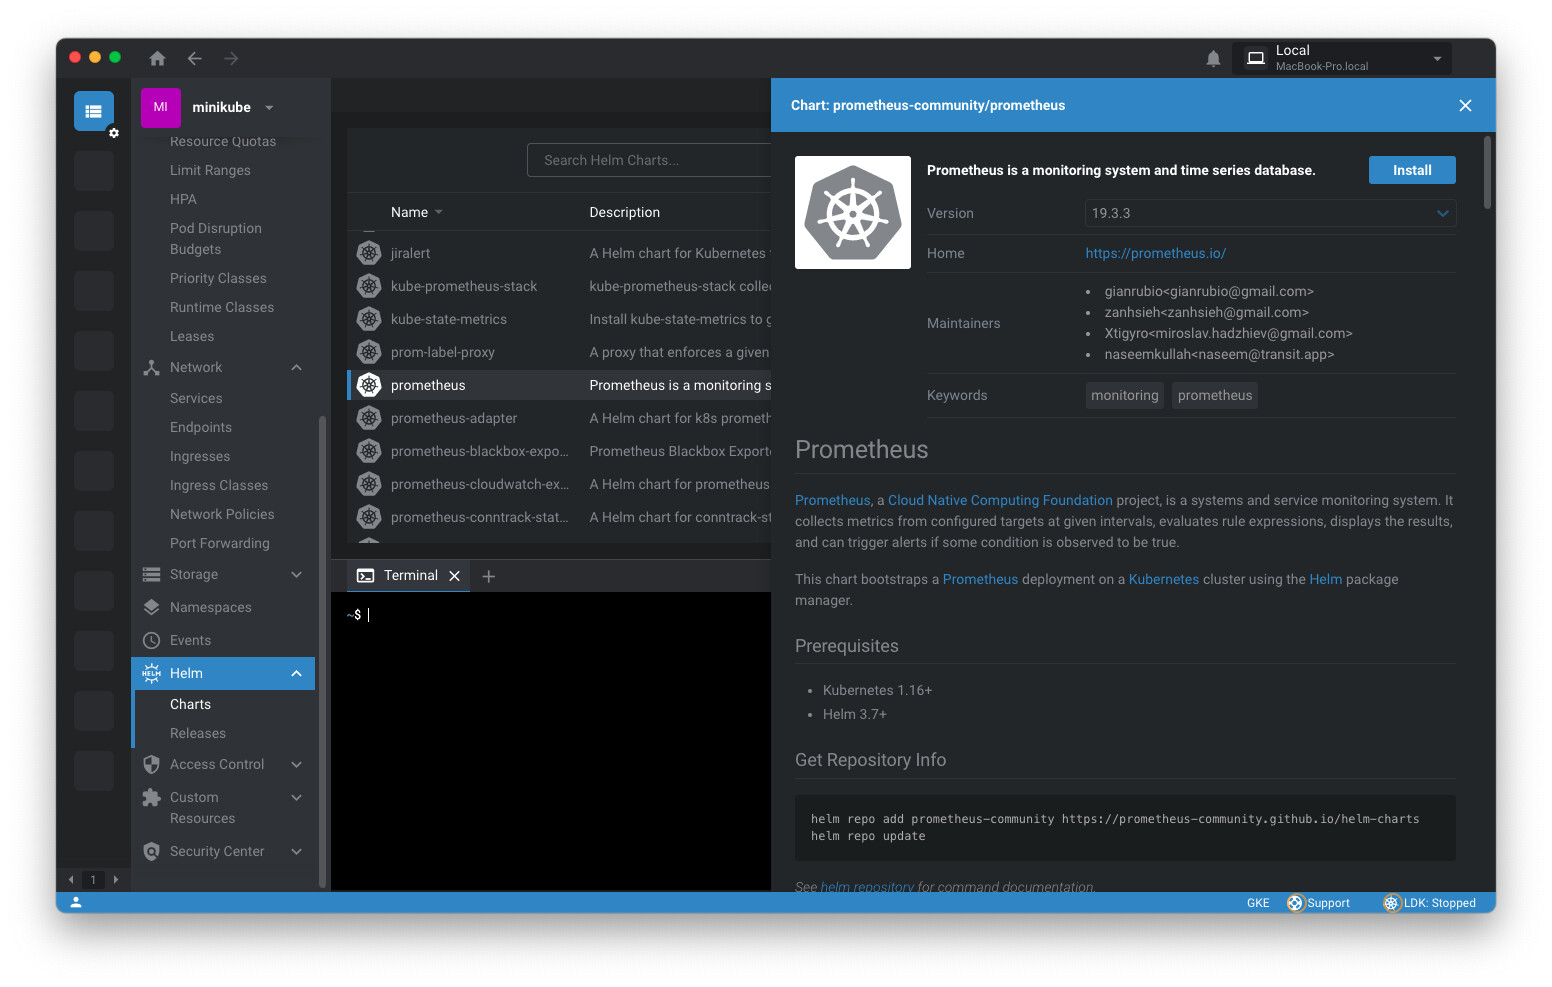
Note this helm chart also installs kube-state-metrics and node-exporter, which are necessary for Lens to show metrics. Install prometheus from Lens (connect to your cluster, in the sidebar pick **Charts** from the **Helm** section, find the prometheus chart):
I created a namespace called monitoring and then modified the helm install to put prometheus in the monitoring namespace:
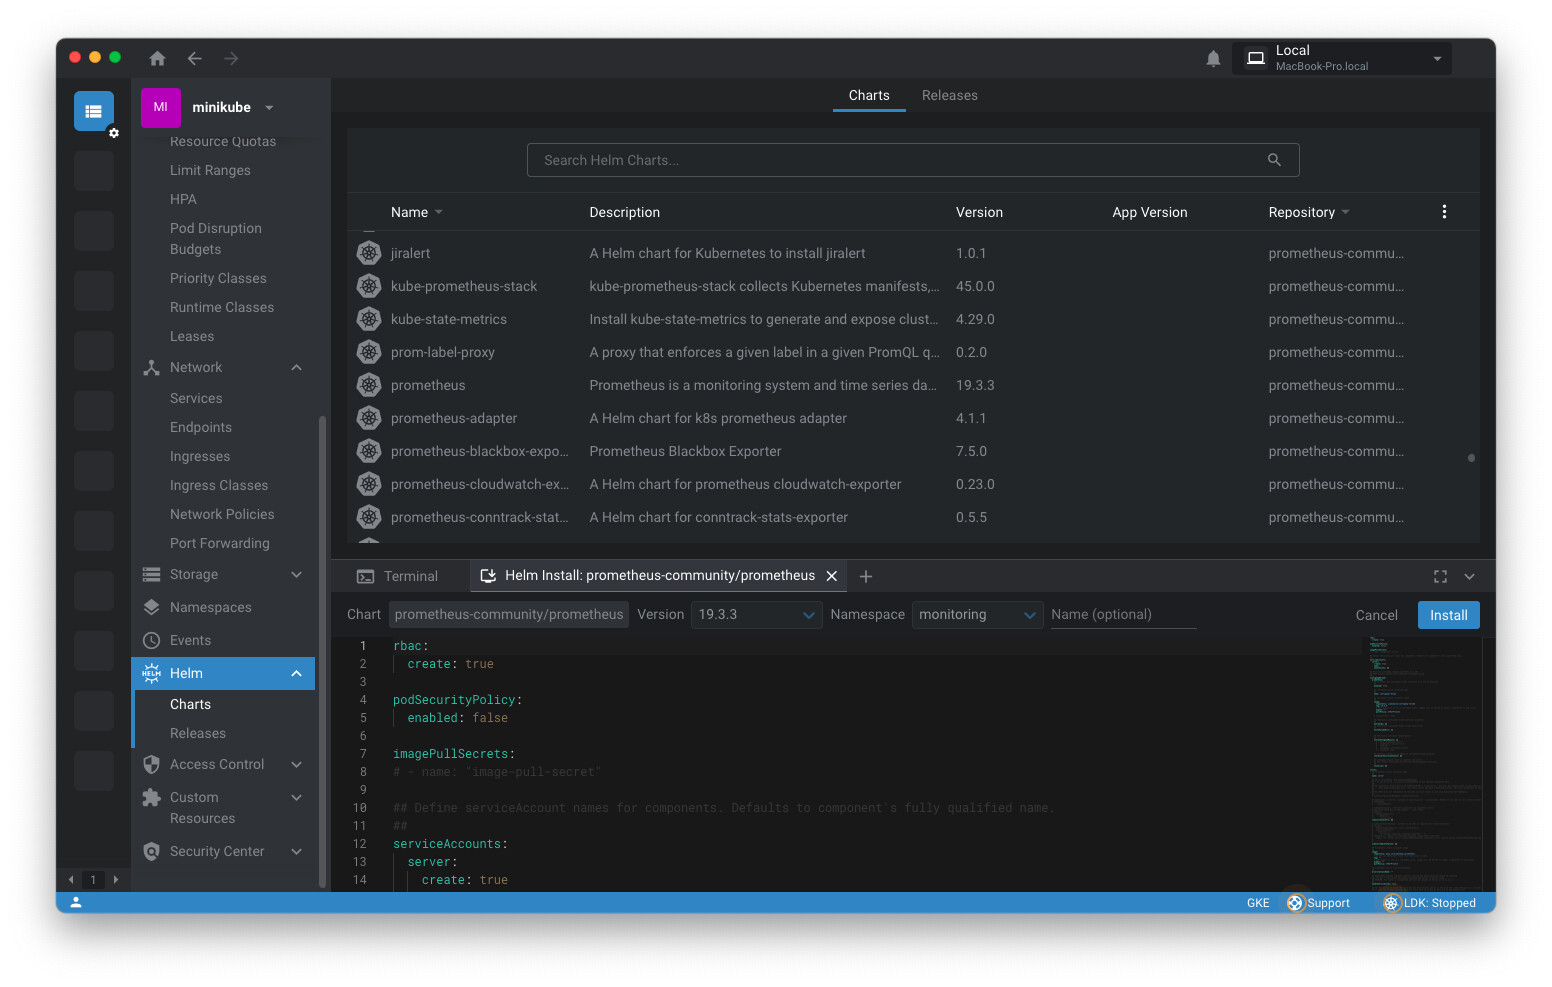
(Prometheus can also just be installed in the default namespace.)
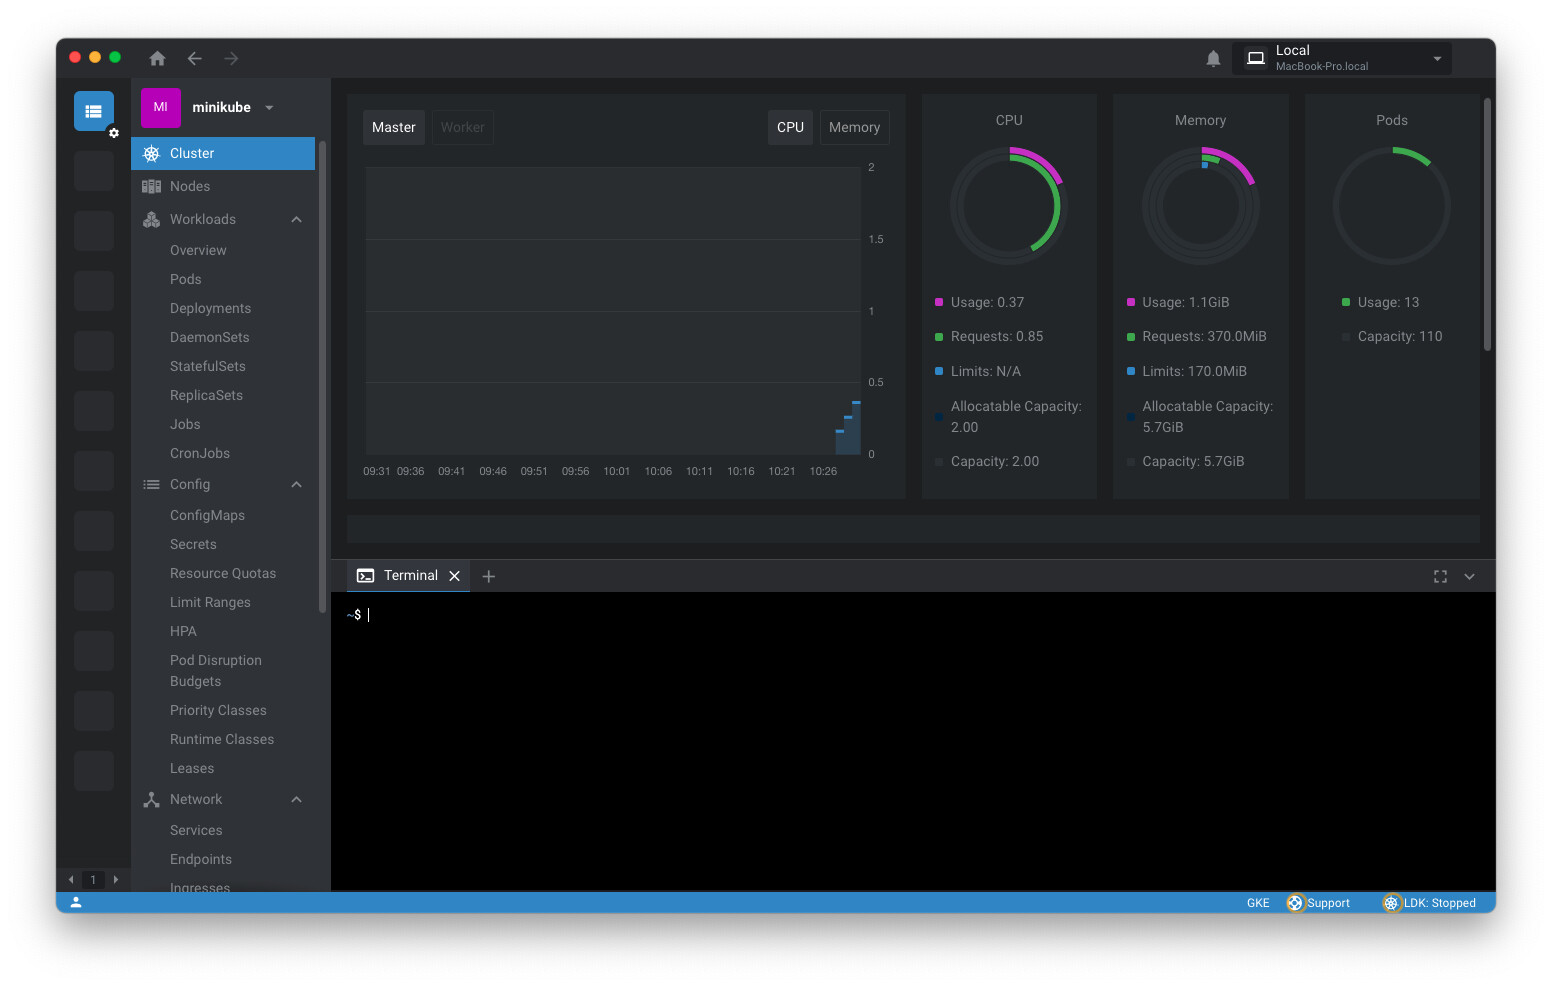
This is what is initially seen for cluster metrics, after the prometheus install:
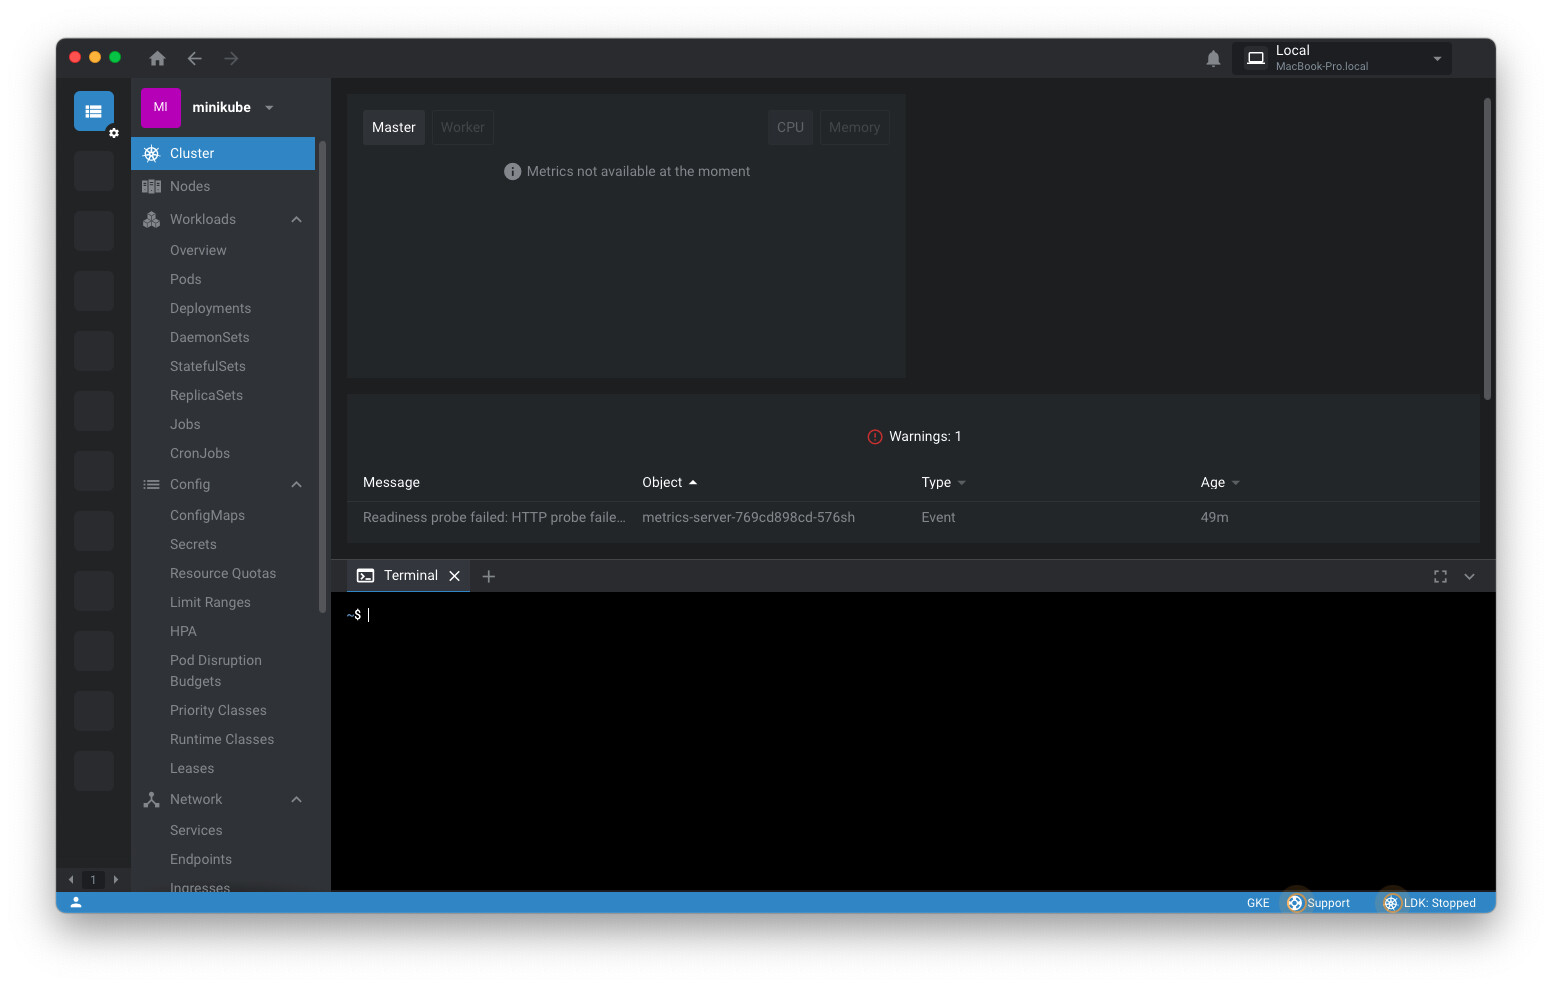
Lens tries to autodetect the prometheus installation but doesn’t work in this case. So instead try setting the config manually by going to the cluster settings, metrics tab:
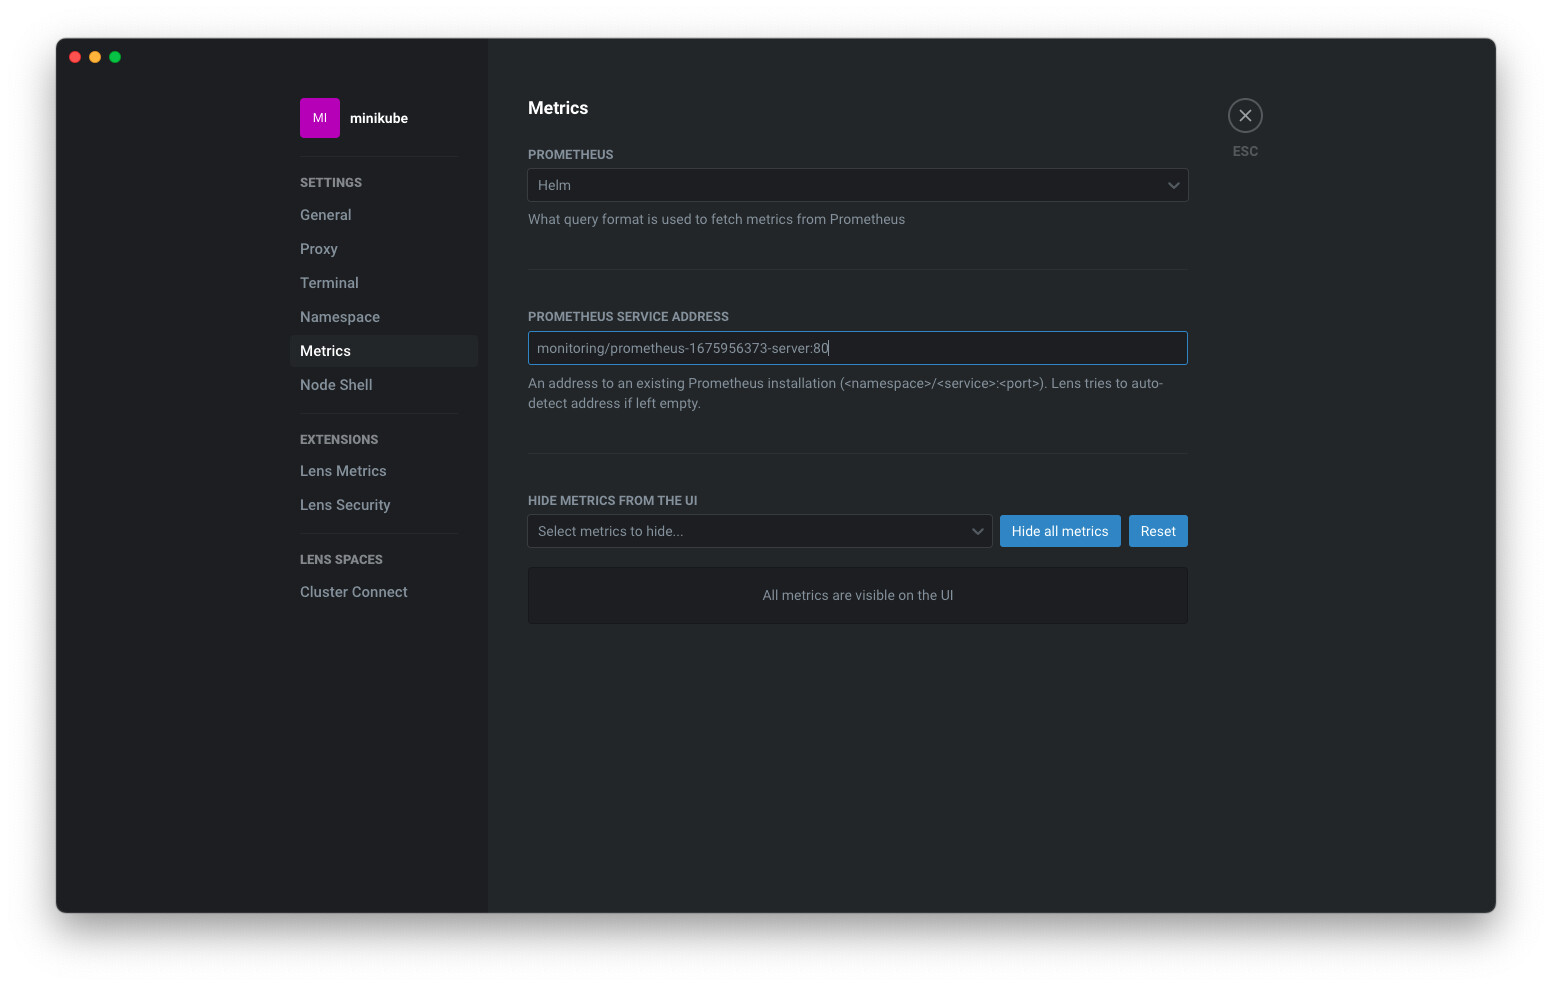
Here, I set the prometheus option to Helm and the PROMETHEUS SERVICE ADDRESS to monitoring/prometheus-1675956373-server:80 as per **\/\:\**. I got the service name and port (80) from the appropriate service:
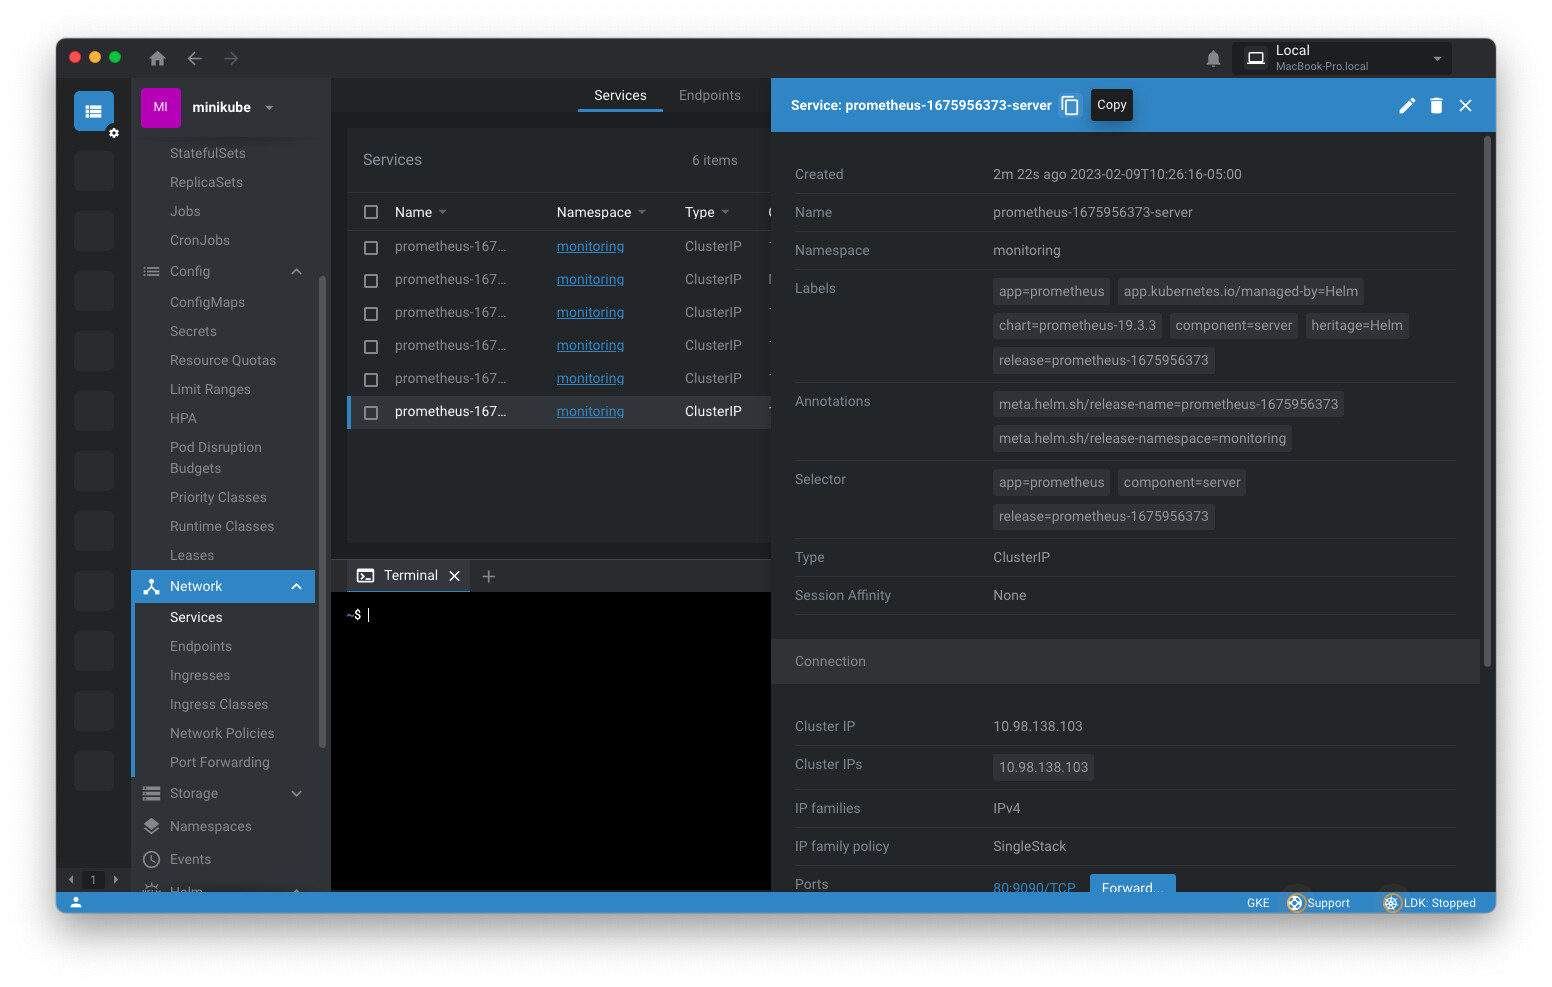
After a minute or two you should see something like this for the Cluster metrics: