We are experiencing intermittent freezing issues with Lens since the release of the new design. The application starts working fine but becomes progressively less responsive after a short period of use, eventually rendering the UI unusable. This happens even when Lens is idle, and it becomes increasingly difficult to close the application. Restarting temporarily resolves the issue, but the problem soon recurs.
We tested this on multiple machines running Windows 10 and 11.
Versions tested:
Stable: 2024.11.261604-latest
Beta: 2024.12.182210-beta (tested to see if the issue was resolved).
Behaviour:
Lens slows down noticeably within about 10 minutes of use.
Memory usage increases rapidly during this time, correlating with the performance degradation.
Ultimately, the UI stops rendering, requiring a restart.
Hi @pkeuter, thanks for reporting. We got similar reports recently and are investigating the root cause of the issue.
Out of curiosity, how many clusters do you have connected when this happens? and when you mentioned that Lens is “idle”, do you have tabs open at all ? or it even happens without checking any tabs?
Any chance you could share a recording? if you don’t want to share it in the forums, you can also send it here support@k8slens.dev, for us to take a look at it. It would be really helpful
Thank you for your message. I typically have one connection open at a time, and at most three simultaneously. However, this doesn’t seem to impact performance.
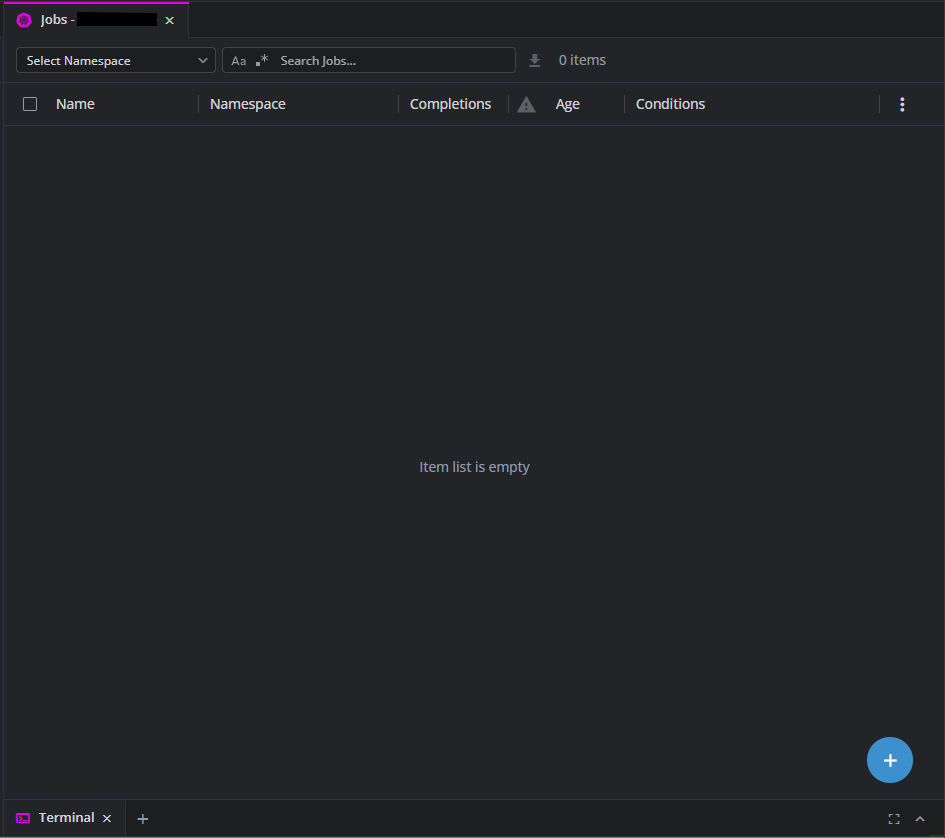
Currently, we aren’t experiencing performance issues when all tabs are closed. By “idle,” I meant that we’re not interacting with the application. That said, even with just one tab open and no content displayed, the freezing still occurs.
Initially, it works fine for about a minute, but then it starts to hang intermittently, first for a second, then for two seconds after a couple of minutes. Over time (around 20 minutes, though not precisely), it becomes completely unresponsive.
I am going to look into making a recording for you to review, but you will see that the entire interface just becomes unresponsive.
Thank you very much @pkeuter for providing this information, it definitely helps narrowing down a few things. If you can provide the recording it would be great. Meanwhile, we are solving a couple of bugs that we think could be part of the cause for this. We’ll share with you the version holding the fixes as soon as we can produce it (for validation of the fixes)
I’m also experiencing this, and this only happens when I connect to a particular cluster. other clusters work fine.
if I disconnect from this particular cluster in between freezes, the issue stops. If I reconnect to that cluster, the issue starts again. If I keep browsing that cluster, after few freezes, the entire UI hangs and I have to restart Lens.
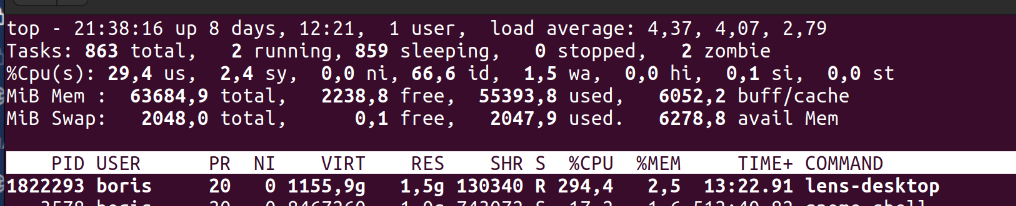
During a freeze, a Lens process is using a lot of CPU:
in terms of pods and nodes it is actually much smaller than other clusters.
but:
it has the highest number of events, but it is not much higher than the others. its number of events is on average 1.5 times higher than the next cluster.
it has the highest number of CRDs (211), other clusters only have 144.
Thank you so much for taking the time to share your findings with us — we really appreciate it!
We’ve actually already been working on a fix for this issue. While it’s not directly related to the number of CRDs, we strongly believe it’s connected and addresses the underlying cause you’ve encountered.
Hi @ceastwood,
sorry to hear you’re running into this issue!
If Lens stays responsive for a moment after launch, please open the in-app support (to find at the bottom on the right side) and send us your logs directly there.
You can use the Export Logs option at the bottom of the support dialog to attach them manually.
It would also be helpful to include a short description of your workflow or cluster setup — for example, whether custom resources (CRDs) or a high number of events might be involved.
If it freezes too quickly to do that, let us know here and we’ll follow up with another way to collect diagnostics.
yes, you can debug this in the Personal version. Two things usually help a lot:
1. Export the support logs
Go to Lens Menu → Help → Export Support Logs .
This gives you a full log bundle, which is super useful to see what Lens was doing around the time the pod accumulated 10+ restarts.
2. Start Lens from your terminal
If you launch Lens via your terminal instead of the app icon, you’ll get live debug output directly in the console.
That often reveals warnings or errors that don’t show up in the UI.
I’m really curious what you’ll discover — especially whether Lens logs anything unusual right when the restarts happen. Feel free to share any findings!
From what I can see, Lens itself doesn’t seem to crash, but there are quite a few errors when it talks to the metrics endpoints (401/404/500 and some “no route to host”). That could make the UI feel frozen, especially when you’re looking at pods with a lot of restarts.
A couple of things you could try:
Check if your metrics setup (metrics-server / Prometheus / Prometheus Operator) is healthy and not returning 401/404.
As a quick test, try disabling metrics/Prometheus for this cluster in the Lens cluster settings and see if the freezes still happen.
Double-check that your machine can reliably reach the cluster and the metrics endpoints (no intermittent network issues).
If it still freezes after that, let me know what exact action you’re doing (e.g. opening details for a specific pod) and grab a fresh log bundle – then we can dig in further.
Hi, it happens when the pod does not start for some reason and keeps restarting, so it is possible the metrics endpoints don’t respond.
When I open detail of this pod, whole lens app freezes and it has to be force quit, because nothing responds.