If you’re reading this, you’re almost certainly familiar with Kubernetes—both the powerful capabilities and the undeniable challenges.
Kubernetes runs containerized applications—often at enormous scale. It helps developers deploy applications with flexible microservices architectures and provides a portable platform for those applications, so you can choose the right infrastructure for your needs and change providers with less difficulty.
The project accomplishes these things by building a layer of abstraction between applications and the infrastructure they run on, whether that is a virtual machine on public or private clouds or bare metal in a traditional data center. For this reason, Kubernetes is often called the “operating system of the cloud.”
But adding a new layer of abstraction inevitably brings consequences for development.
Speed and accuracy
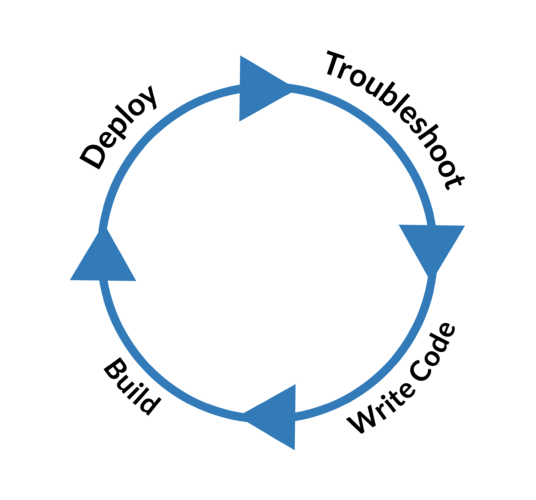
When we write code, we repeatedly build and deploy our work-in-progress to a development environment to see whether it’s working properly, to identify errors, and to iterate—over and over again. This process is called the inner loop . Broadly speaking, the steps look like this:
Ideally, we would like our inner loop to be fast and accurate . Of course we want our work to be as efficient as possible, but it also needs to reflect what will happen in production; our development environment should mirror the production environment as closely as possible. Indeed, this is one of the most powerful arguments for containers: helping us to avoid “it worked on my machine.”Managing the inner loop is a matter of balancing speed and accuracy. We sacrifice velocity for correctness (and to save time in the long run).
For example, I could create a Go module and run it on my laptop through the course of development. This would be faster than containerizing it and deploying it to a Kubernetes cluster, whether manually or even through an automated pipeline. But it will result in code tailored to my laptop. If the module is destined to run on a Kubernetes cluster, I need to see how it runs in that environment—how it interacts with Kubernetes resources as it would do in production. I’ll need to:
- Build my Go code
- Build a container image
- Upload my image to a registry
- Deploy the image to Kubernetes (a dev cluster or namespace)
The good news is that we can largely automate the build and deploy steps away with a continuous integration (CI) system. The bad news is that this is only the beginning of our inner loop development challenges.
The collective loop
Suppose you’ve written a simple HTTP server. It’s been pretty painless so far—your CI system handled the image-building and deployment, and the module is deployed in a pod on your local development cluster. Now you need to check whether your code works properly.
Out of the box, that means you’re using the kubectl command-line client. It’s an excellent CLI tool, and you’re pretty comfortable with it—but even so, performing a basic task like checking your code is going to require learning some new syntax and going through some extra steps. For more complicated or less common operations, you’re less likely to remember the specific syntax, so you might need to go digging online.
To check that the pod is deployed…
% kubectl get pods
That’s simple. Now you can find and copy the name of your pod, which will almost certainly have a unique identifier appended. If you want to see logs, that’s pretty easy, too:
% kubectl logs example-pod-1674484351
But no, you want continuously streaming logs, so you need to add the flag for that, which you should remember but it’s just on the tip of your brain, so you do a quick search—okay, yes, -f for follow…
% kubectl logs -f example-pod
So now you open a new terminal tab on your laptop, and you want to run some curl commands against the server, but this server is running as a ClusterIP service, which means it’s only available within the cluster. So you’ll need to forward the port for that service to a port on your local machine…
% kubectl port-forward example-pod-1674484351 [local port]:[pod port]
The port-forward is going to keep running in this terminal tab, so you’ll need to open another tab, and now you can do the testing you need to do. If you find issues and decide that they’re stemming from Kubernetes resource misconfiguration rather than code problems, you might start by looking over the detailed status of the pod…
% kubectl describe pod example-pod-1674484351
Name:             http-server
Namespace:        default
Priority:         0
Service Account:  default
Node:             minikube/192.168.49.2
Start Time:       Fri, 17 Mar 2023 17:15:12 -0400
Labels:           run=http-server
Annotations:      <none>
Status:           Running
IP:               172.17.0.15
IPs:
  IP:  172.17.0.15
Containers:
  http-server:
    Container ID:   docker://e5a8588afaaa5bd2b6247ac83e072807983d38929c8ec055da4095d4b097387a
    Image:          ericgregory/http-server
    Image ID:       docker-pullable://ericgregory/http-server@sha256:506d11353a868d167d45003594bcc199bce468f171f51ddf3daa1d8c24f1b2be
    Port:           <none>
    Host Port:      <none>
    State:          Running
      Started:      Fri, 17 Mar 2023 17:15:14 -0400
    Ready:          True
    Restart Count:  0
    Environment:    <none>
    Mounts:
      /var/run/secrets/kubernetes.io/serviceaccount from kube-api-access-wzvpd (ro)
Conditions:
  Type              Status
  Initialized       True
  Ready             True
  ContainersReady   True
  PodScheduled      True
Volumes:
  kube-api-access-wzvpd:
    Type:                    Projected (a volume that contains injected data from multiple sources)
    TokenExpirationSeconds:  3607
    ConfigMapName:           kube-root-ca.crt
    ConfigMapOptional:       <nil>
    DownwardAPI:             true
QoS Class:                   BestEffort
Node-Selectors:              <none>
Tolerations:                 node.kubernetes.io/not-ready:NoExecute op=Exists for 300s
                             node.kubernetes.io/unreachable:NoExecute op=Exists for 300s
Events:
  Type    Reason     Age   From               Message
  ----    ------     ----  ----               -------
  Normal  Scheduled  25s   default-scheduler  Successfully assigned default/http-server to minikube
  Normal  Pulling    24s   kubelet            Pulling image "ericgregory/http-server"
  Normal  Pulled     23s   kubelet            Successfully pulled image "ericgregory/http-server" in 592.243022ms
  Normal  Created    23s   kubelet            Created container http-server
  Normal  Started    23s   kubelet            Started container http-server
Maybe the CLI output will show you where the problem lies. Maybe not. If not, you may need to go spelunking through other resources and configurations.
Even if we’re perfectly fluent on the command line, this time adds up. Across hours and days and months, across teams and organizations, lost time adds up exponentially . Many of our colleagues will need to learn kubectl (and indeed basic Kubernetes concepts) from zero. This can cause the collective inner loop to balloon dramatically at the troubleshooting step, and if we don’t plan for this problem, it amounts to a Day 1 misconfiguration—an error that can cost us dearly.
In search of lost time
So how do we solve this problem?
Ultimately, it’s a matter of user experience —the ability of many users, in this case developers, to navigate information and take the actions they need to take. We need a user experience tailored to the needs of Kubernetes developers—and in a team context, we want it to be easy for Kubernetes beginners to get started. A command-line client like kubectl is a refined instrument for Kubernetes professionals, but the developers on our team aren’t Kubernetes pros, and they shouldn’t have to be—not if their job is to write, troubleshoot, and push code. They need a simpler and more intuitive way to interact with the cluster.
This is Lens —often described as an integrated development environment (IDE) for Kubernetes, because it consolidates many quality-of-life improvements for developers in a way reminiscent of IDEs. But really, it’s an easy and powerful way to do what you need to do with a Kubernetes cluster.
Let’s rewind to the point where our app was deployed. Actually, we’ll go a bit further back, because instead of running a standalone third-party tool to get a development cluster on our machine, we’re running a virtualized cluster called Lens Desktop Kube through Lens itself with a single click.
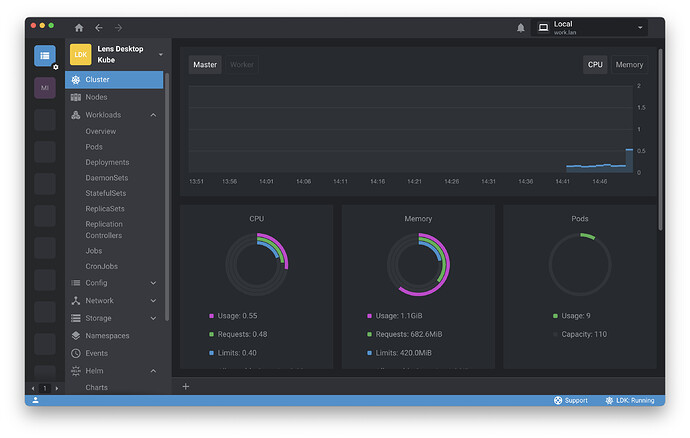
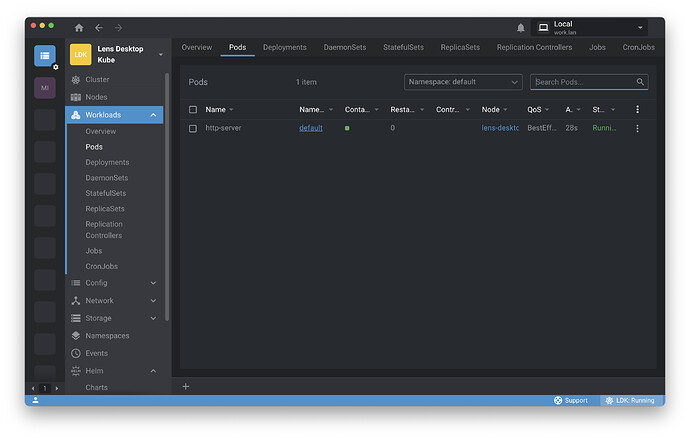
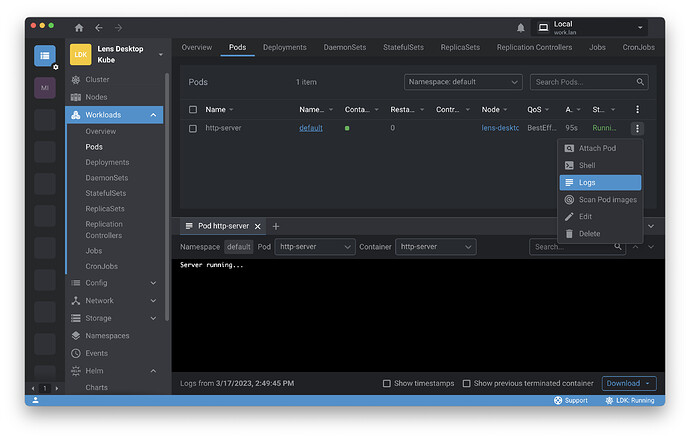
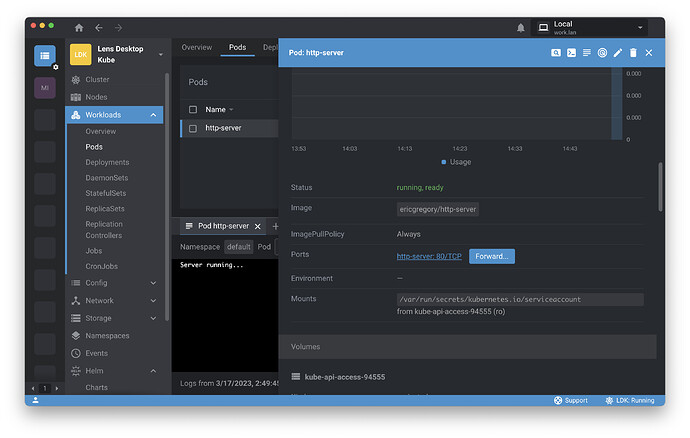
From your Cluster Overview screen, you have a panoramic view of resource usage on the cluster. You can click on Pods in the navigation panel to take a look at pods on the cluster. There’s your HTTP server. You can simply click the ellipsis and select Logs to check out the logs. (You can also perform tasks like opening an interactive shell within the container or scanning for vulnerabilities from this menu.) Lens opens a log pane, and everything looks good here. Note that you could download logs or show logs from terminated containers if things weren’t looking quite so rosy.Now you’d like to test the server with curl. You can simply click on the pod name to bring up a pane with detailed information on the pod, as well as a Port Forward button.
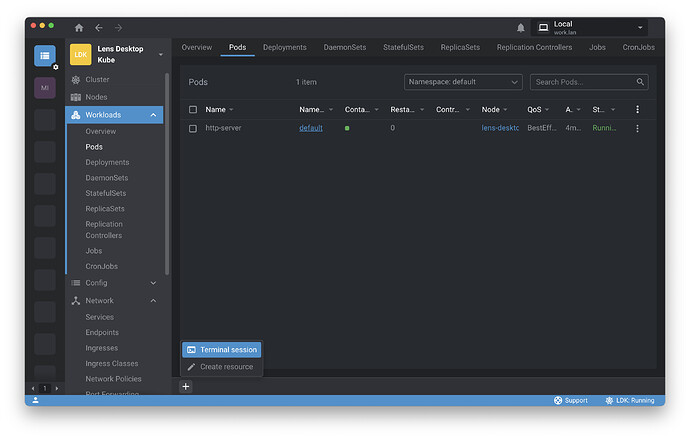
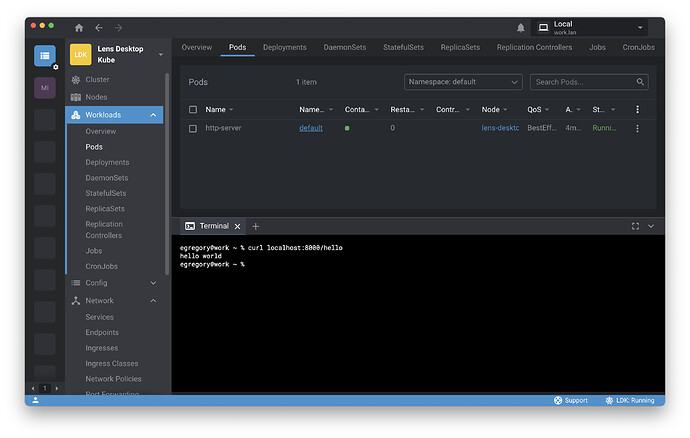
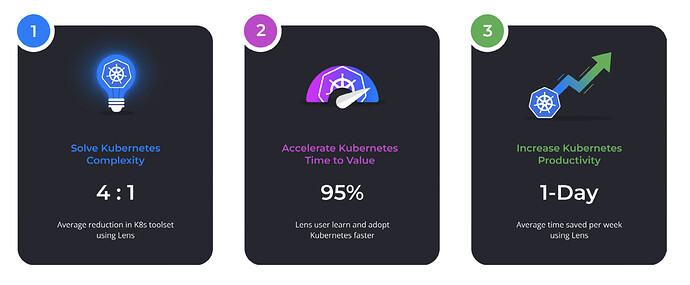
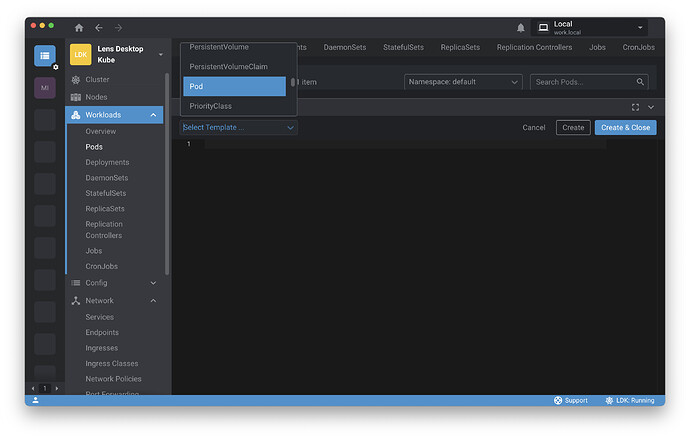
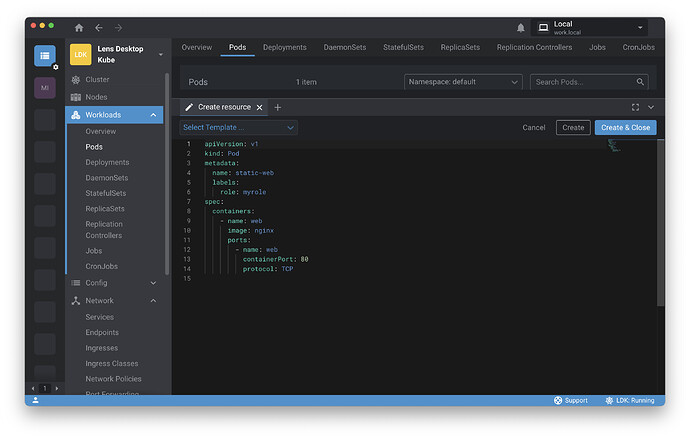
You click Forward , then close the pod and log panes. No need to open a separate terminal app—you can open a terminal session within Lens by clicking on the plus sign in the lower left-hand corner. (You can also use this button to add a new Kubernetes resource to the cluster.) Click Terminal Session . Command-line work is a first-class citizen in Lens. You can even use kubectl from within Lens, if you’re partial to the command line or find it efficient for certain tasks.Lens gives you the flexibility to work with Kubernetes in the way that works for you, and it brings considerable gains in efficiency for the inner loop. We’ve found the following optimizations for professional Lens users:
As with the time an organization can lose in aggregate, these gains add up quickly—and that means Lens makes a particularly critical difference in a team context.In the next chapter, we’ll explore how Lens can make it simple to work with Kubernetes as a team.
Try it yourself
Want to work through the steps from this chapter? Download Lens and follow the installation instructions. Then click the plus sign we used to open a terminal session and instead create a resource. You can create a resource from a template for many different Kubernetes resources—select Pod.
This article was written by Eric Gregory for Mirantis!

