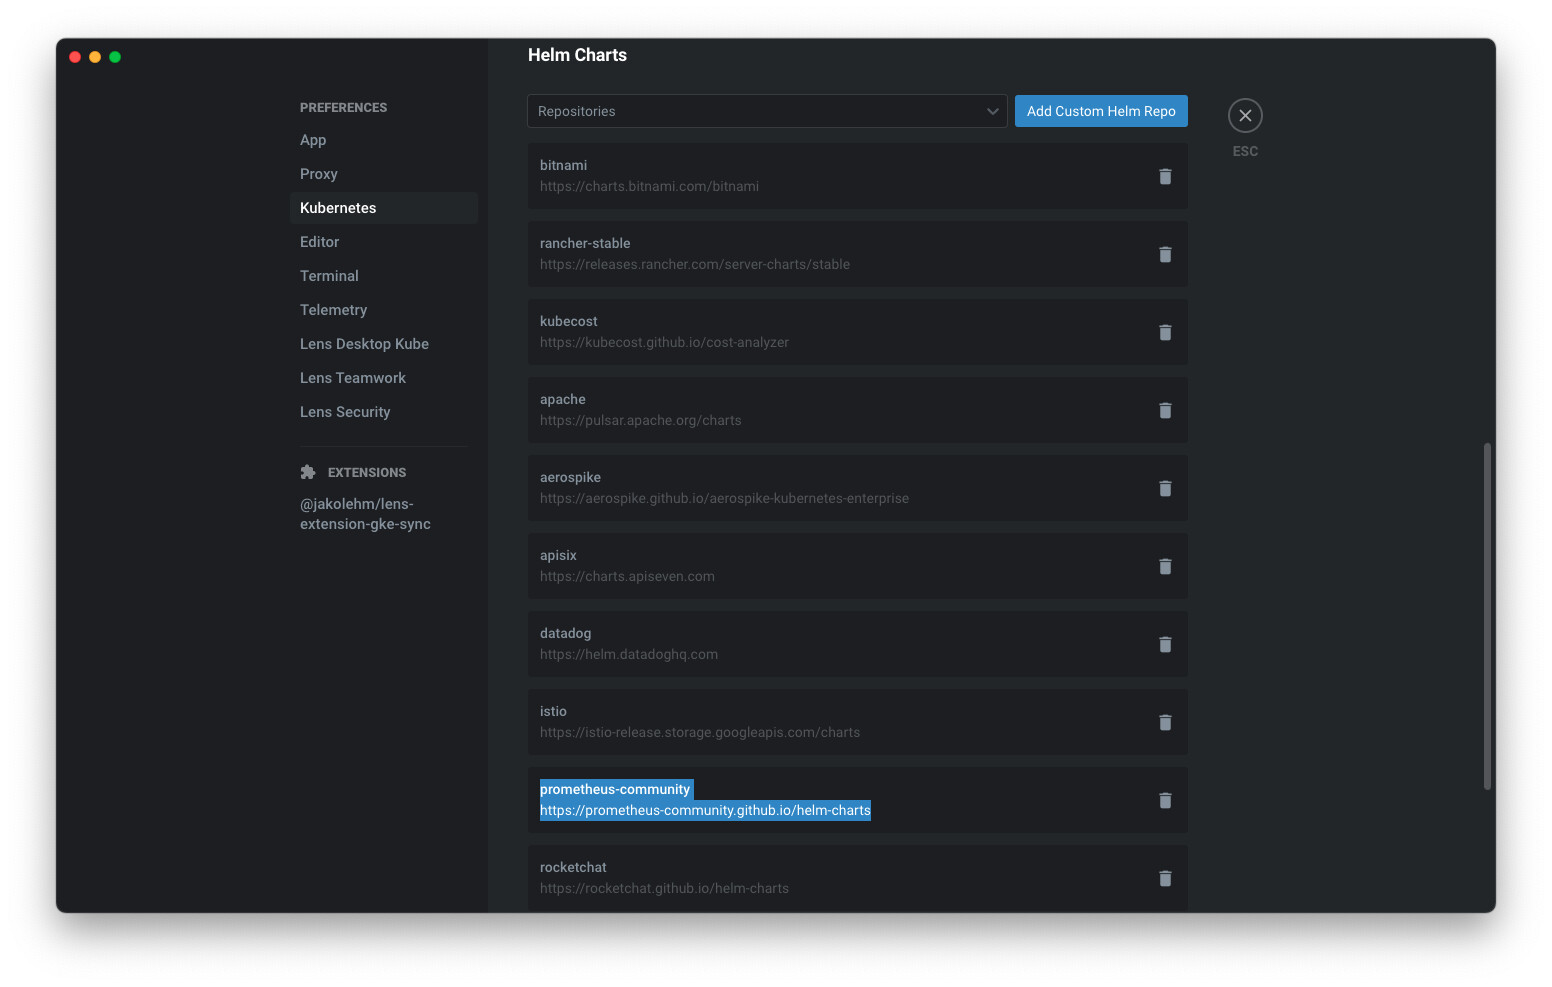
Install the prometheus chart from the prometheus-community repo (Prometheus Community Kubernetes Helm Charts | helm-charts). You may need to add it as a custom repo to Lens (you can add custom helm repos by picking Preferences from the Lens menu, select the Kubernetes tab, find the Helm Charts section, click Add Custom Helm Repo):
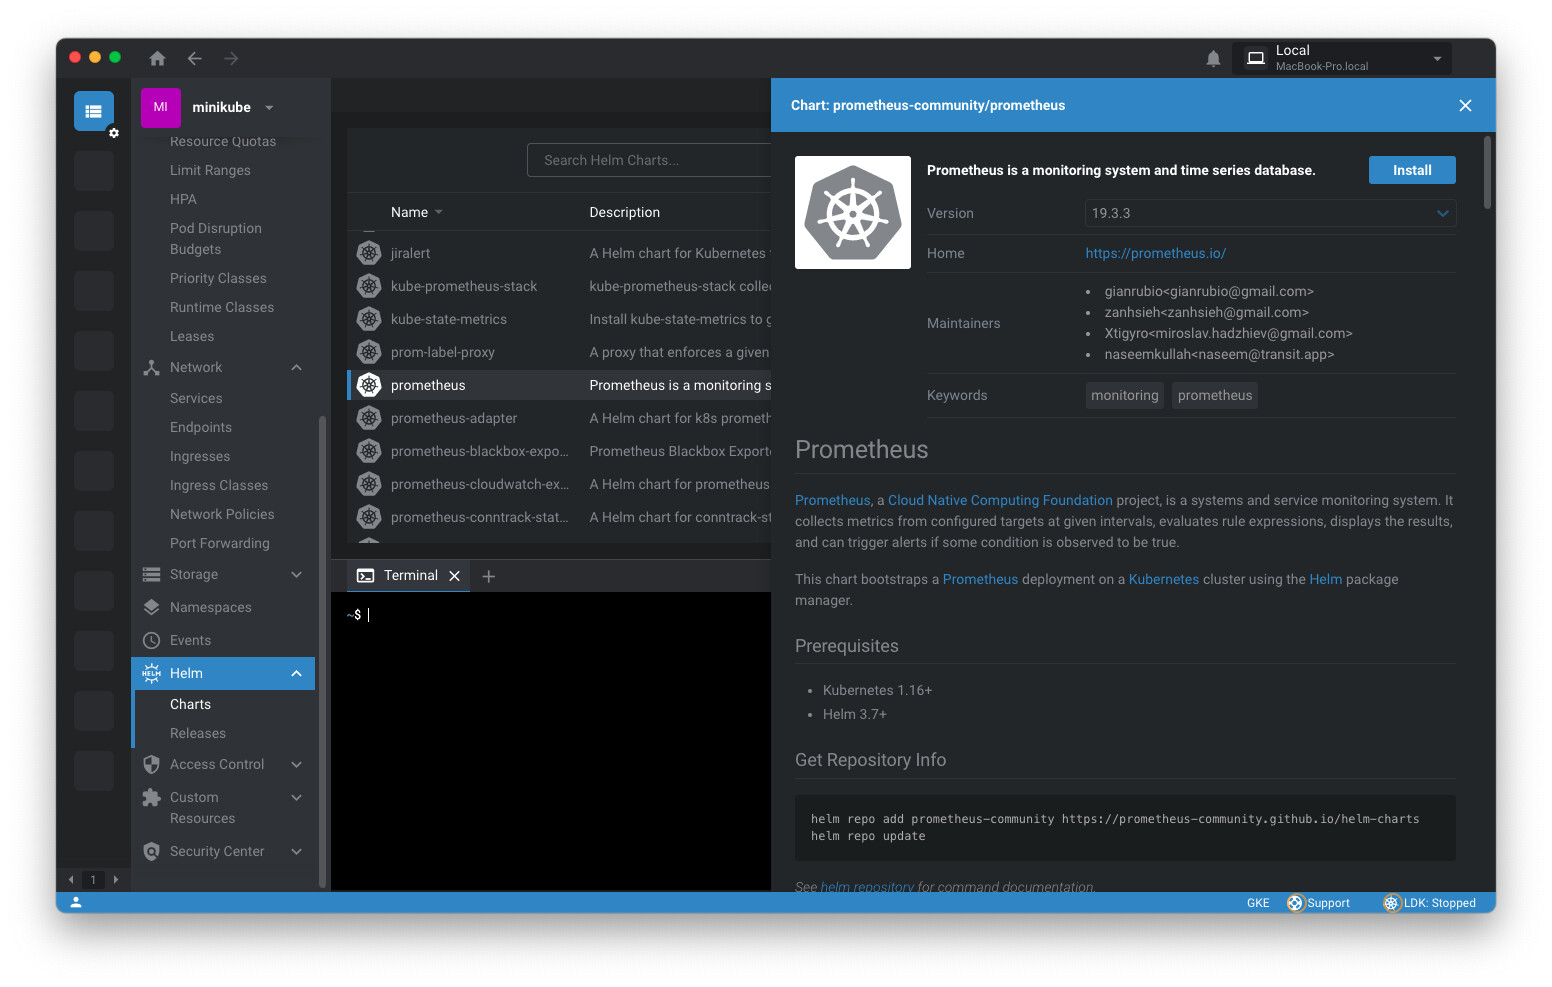
Note this helm chart also installs kube-state-metrics and node-exporter, which are necessary for Lens to show metrics. Install prometheus from Lens (connect to your cluster, in the sidebar pick Charts from the Helm section, find the prometheus chart):
I created a namespace called monitoring and then modified the helm install to put prometheus in the monitoring namespace:
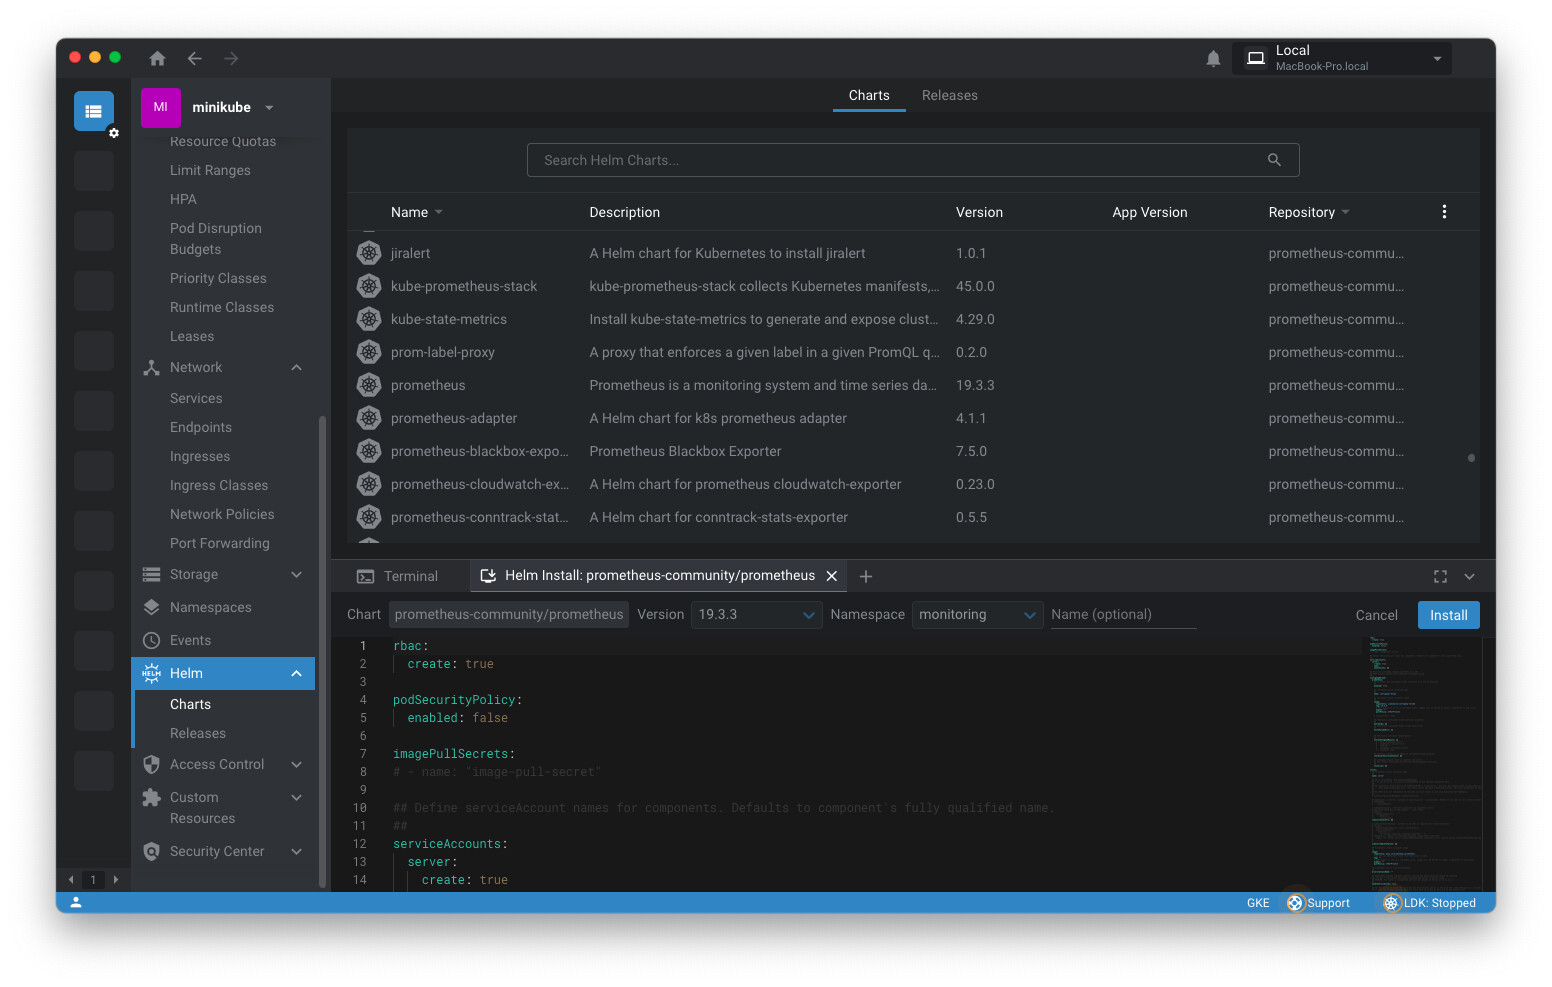
(Prometheus can also just be installed in the default namespace.)
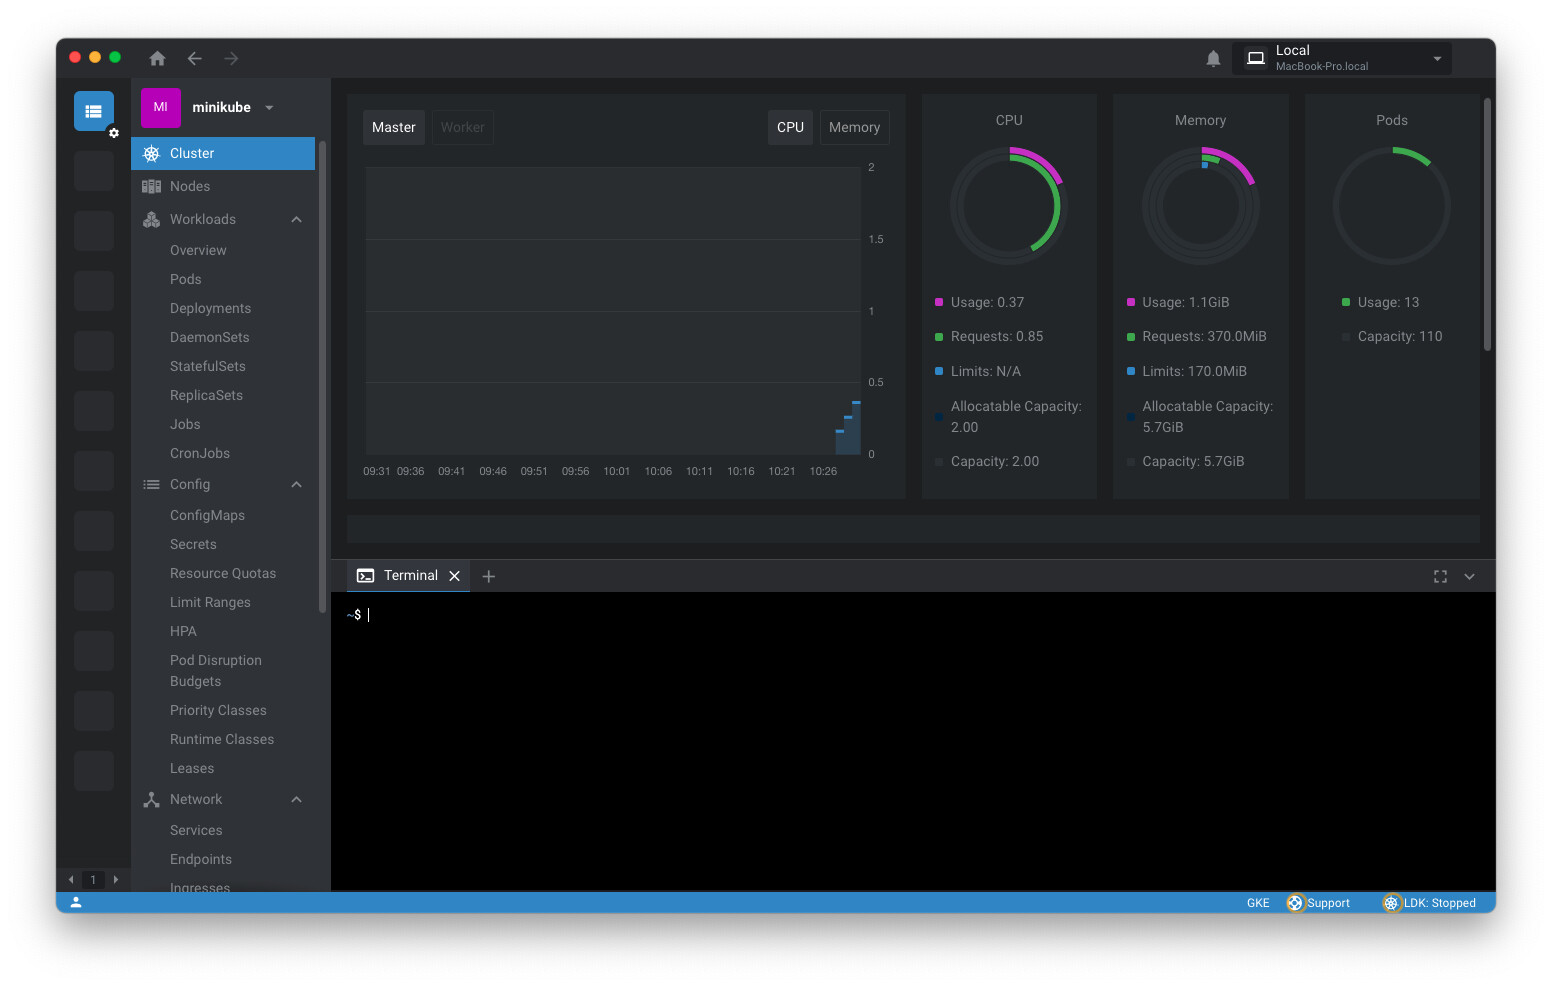
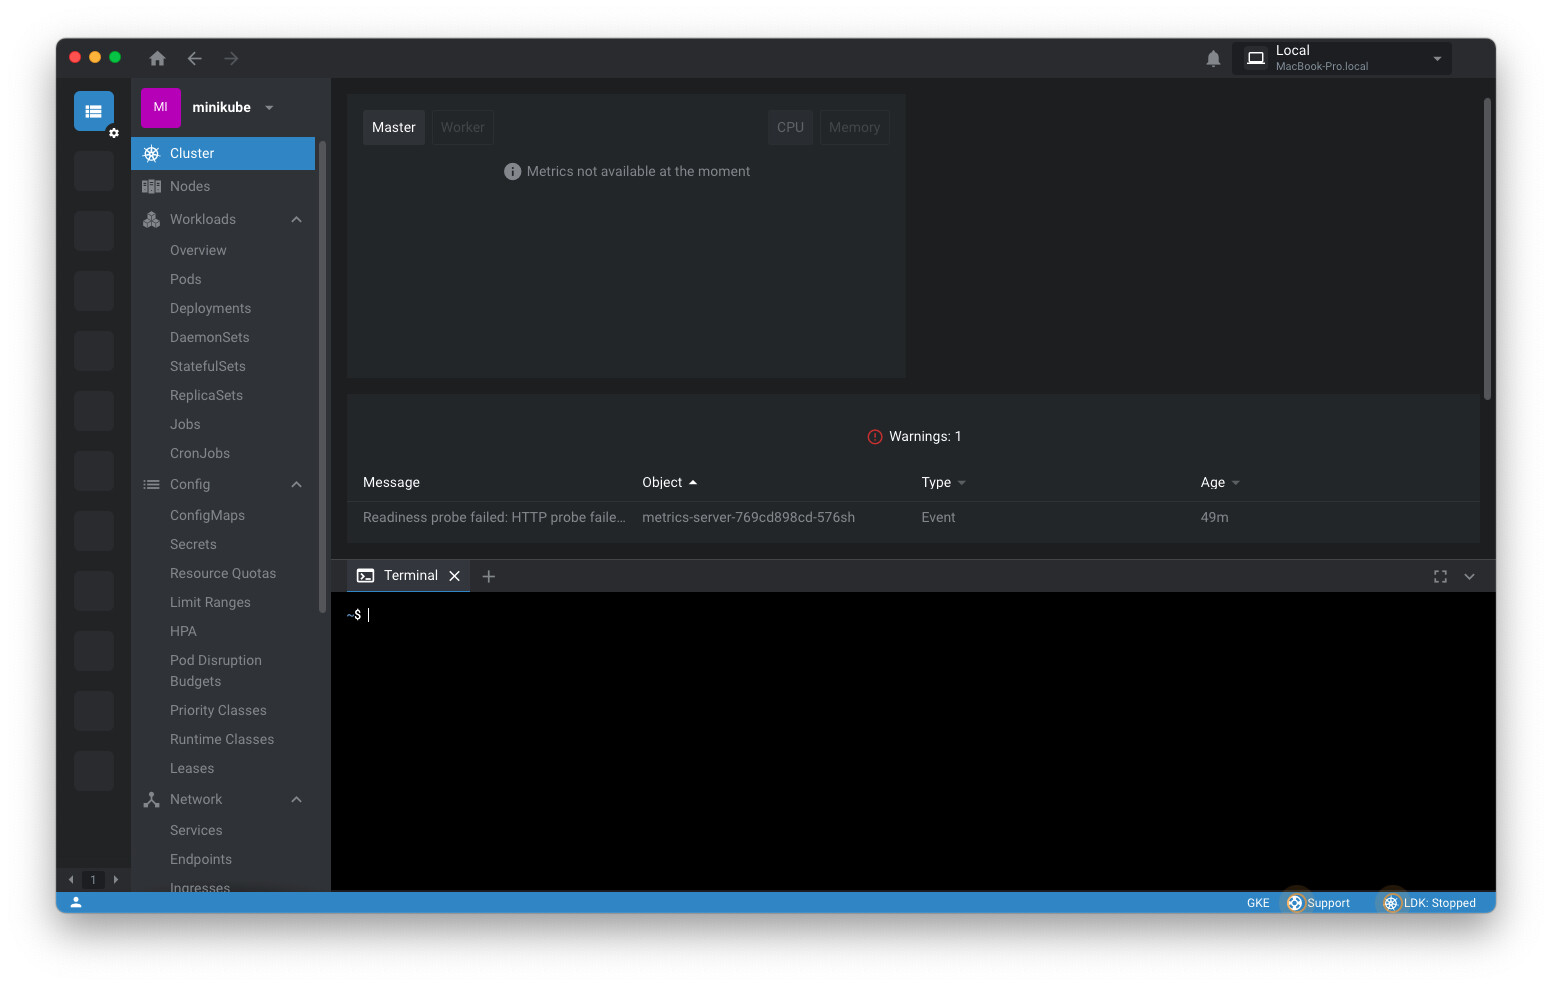
This is what is initially seen for cluster metrics, after the prometheus install:
Lens tries to autodetect the prometheus installation but doesn’t work in this case. So instead try setting the config manually by going to the cluster settings, metrics tab:
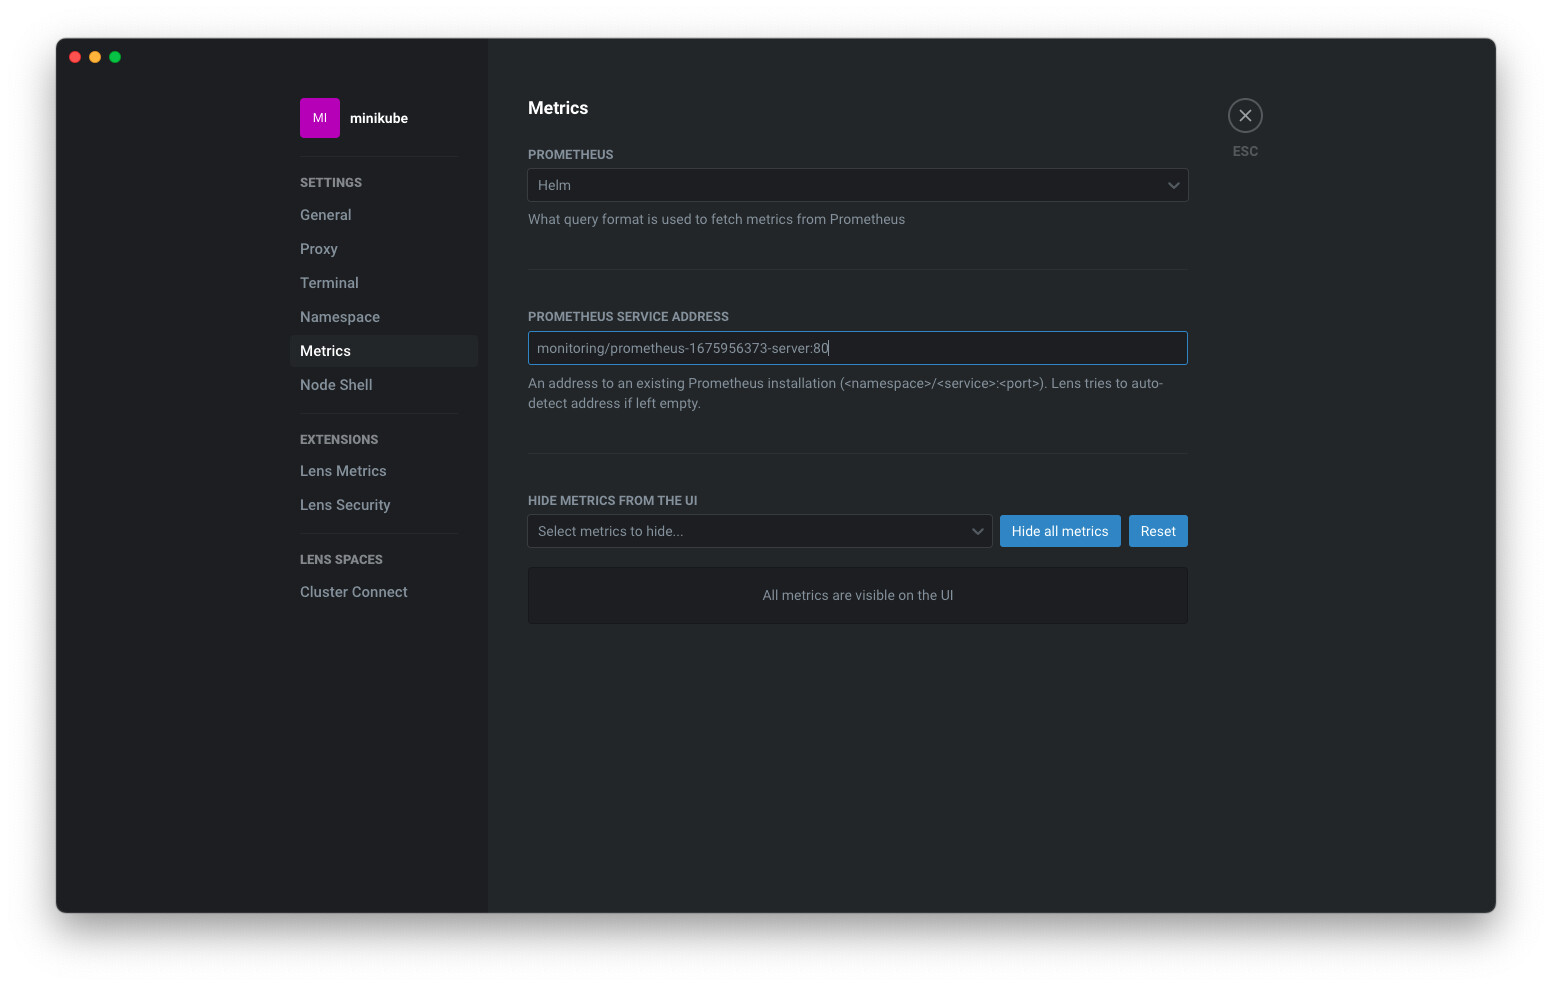
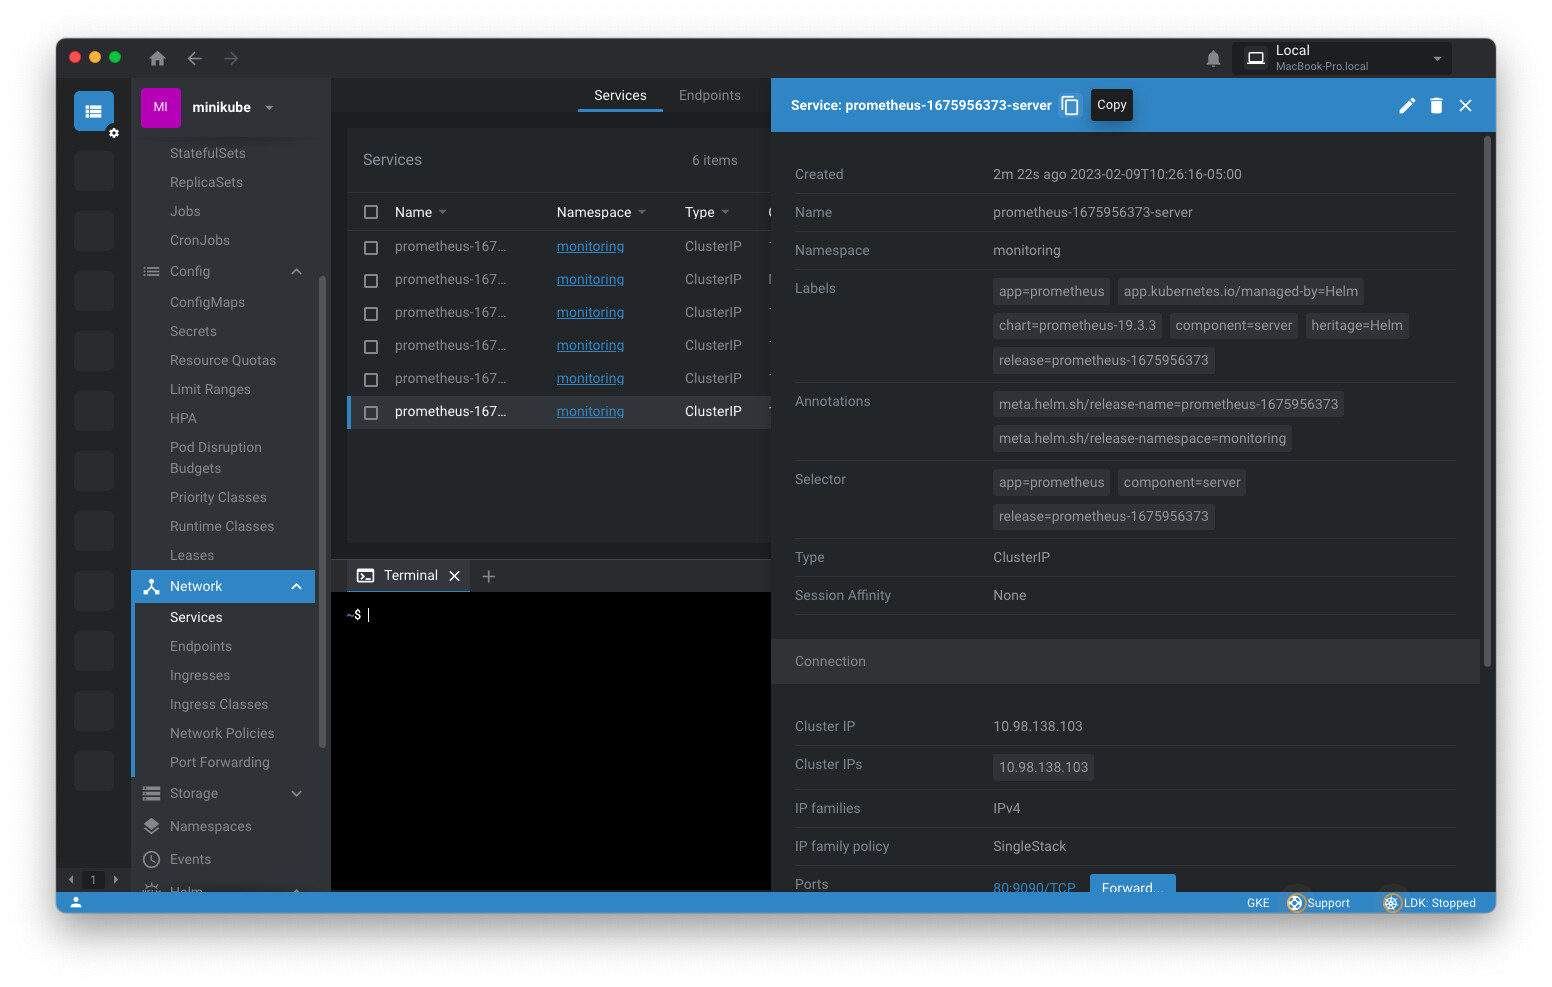
Here, I set the prometheus option to Helm and the PROMETHEUS SERVICE ADDRESS to monitoring/prometheus-1675956373-server:80 as per <namespace>/<service>:<port>. I got the service name and port (80) from the appropriate service:
After a minute or two you should see something like this for the Cluster metrics: